
This guide shows how to create a dataset of an assigned OD matrix (i.e. simulated traffic) based on observed traffic counts. The resulting traffic counts dataset represents traffic demand and defines how that traffic behaves when it is evaluated in a scenario.
When should I use this
Use a traffic counts dataset when you want to simulate existing traffic conditions based on observed traffic counts.
This dataset type is typically used for:
- Establishing a base traffic situation
- Analysing how changes to the road network affect current traffic patterns
Before you start
You need:
- A project
- Traffic counting data: junction traffic counts or single direction link counts from loops or other traffic counting equipment
Steps
1. Start a new traffic counts dataset
- Open your project
- Click New dataset
- Select Traffic counts dataset
- Enter a name for the dataset
The dataset editor will open.
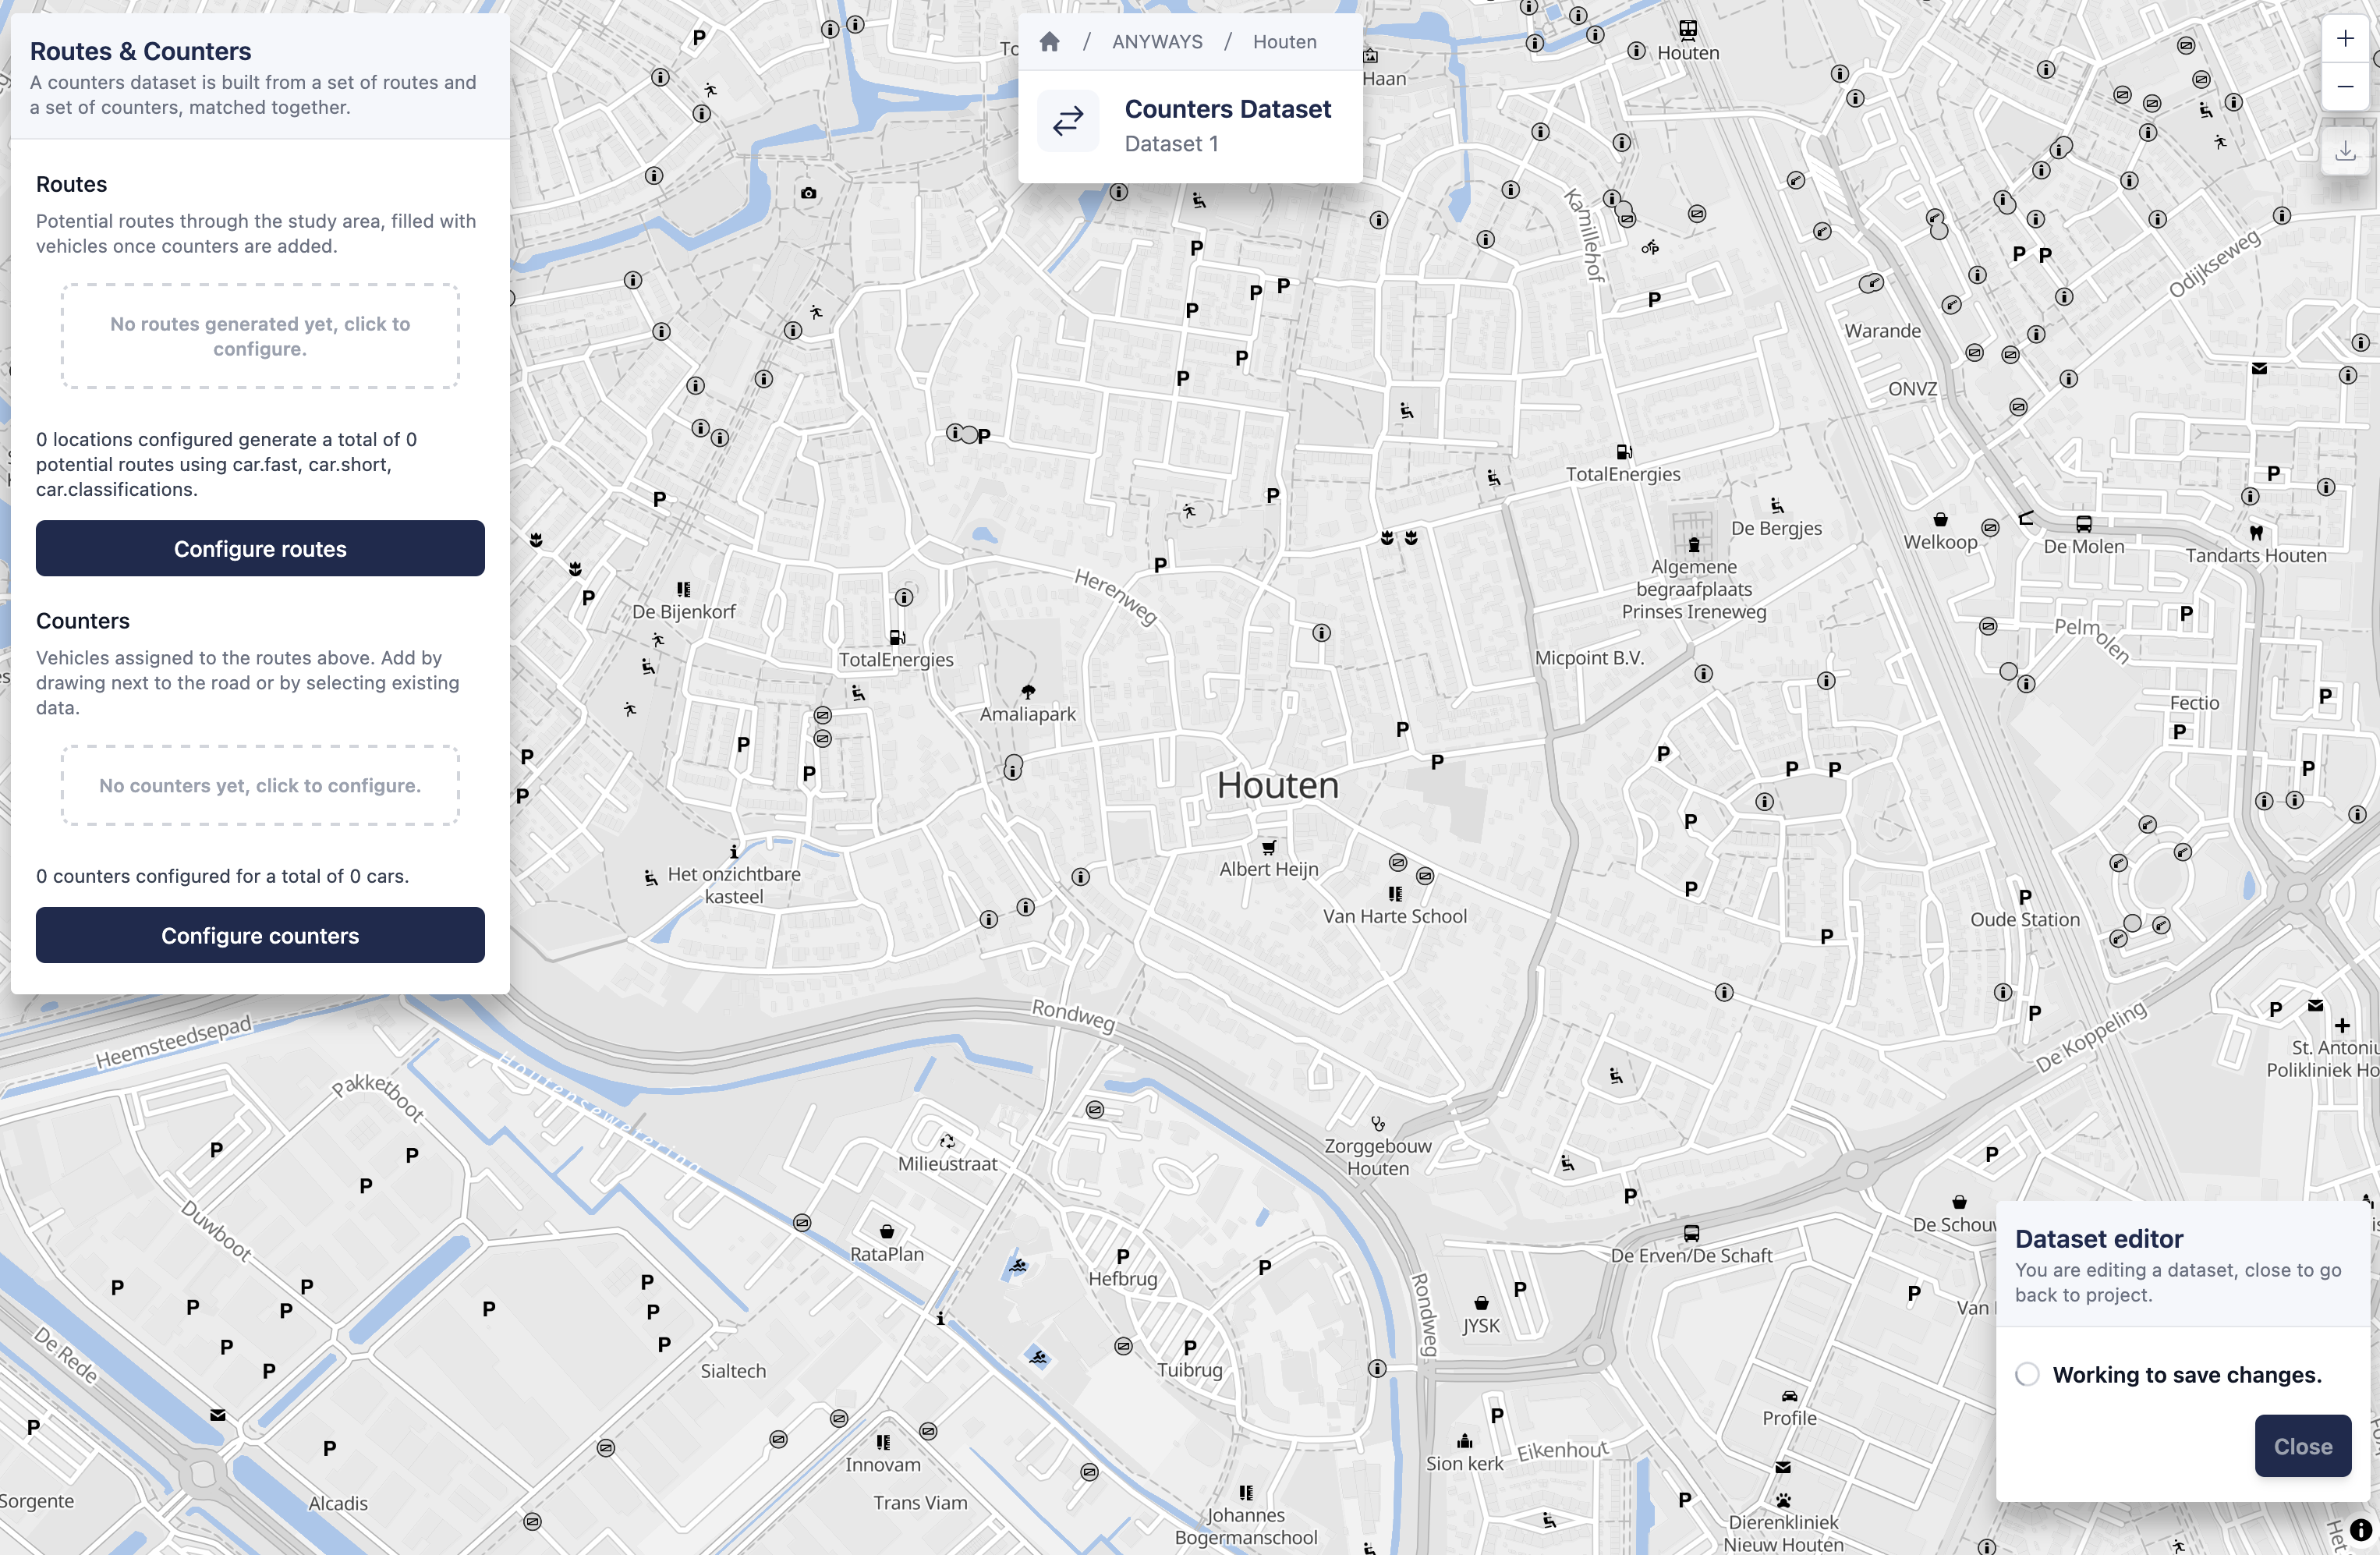
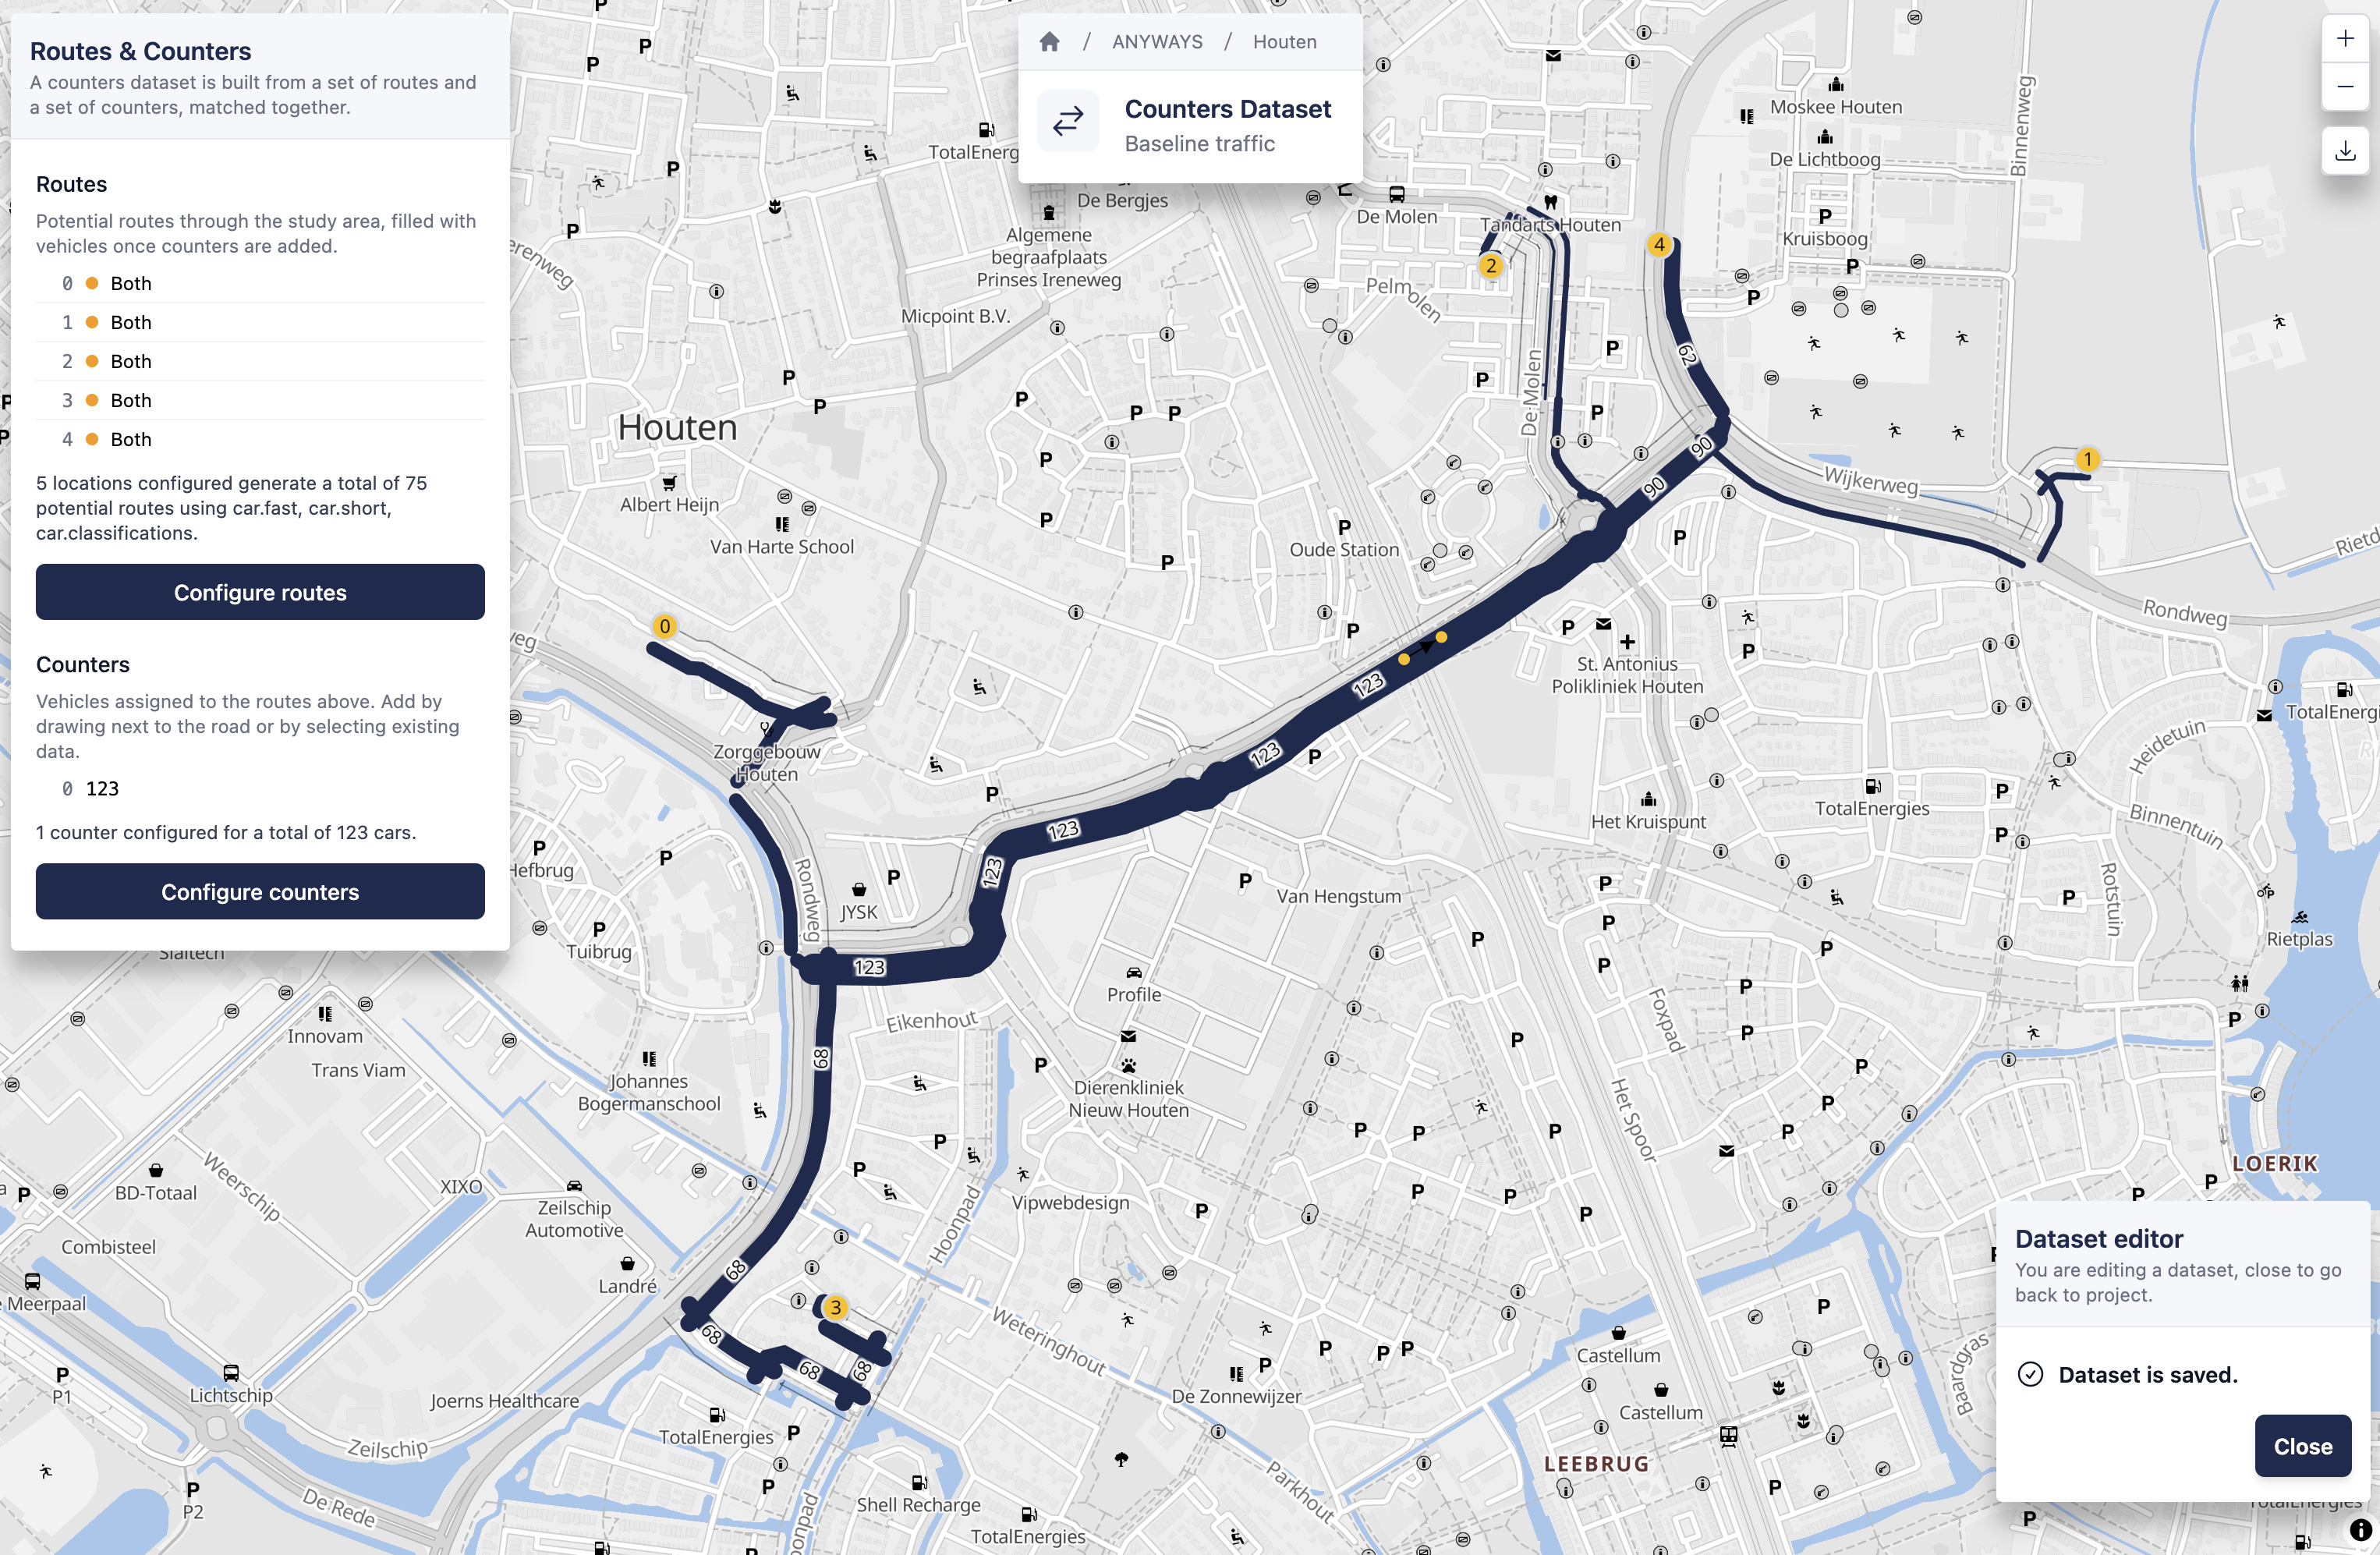
2. Routes
The first part of the workflow defines the routes: the set of possible trips between origins and destinations you choose, calculated using the selected vehicle profiles. At this stage no traffic volumes are defined yet — the routes are empty.
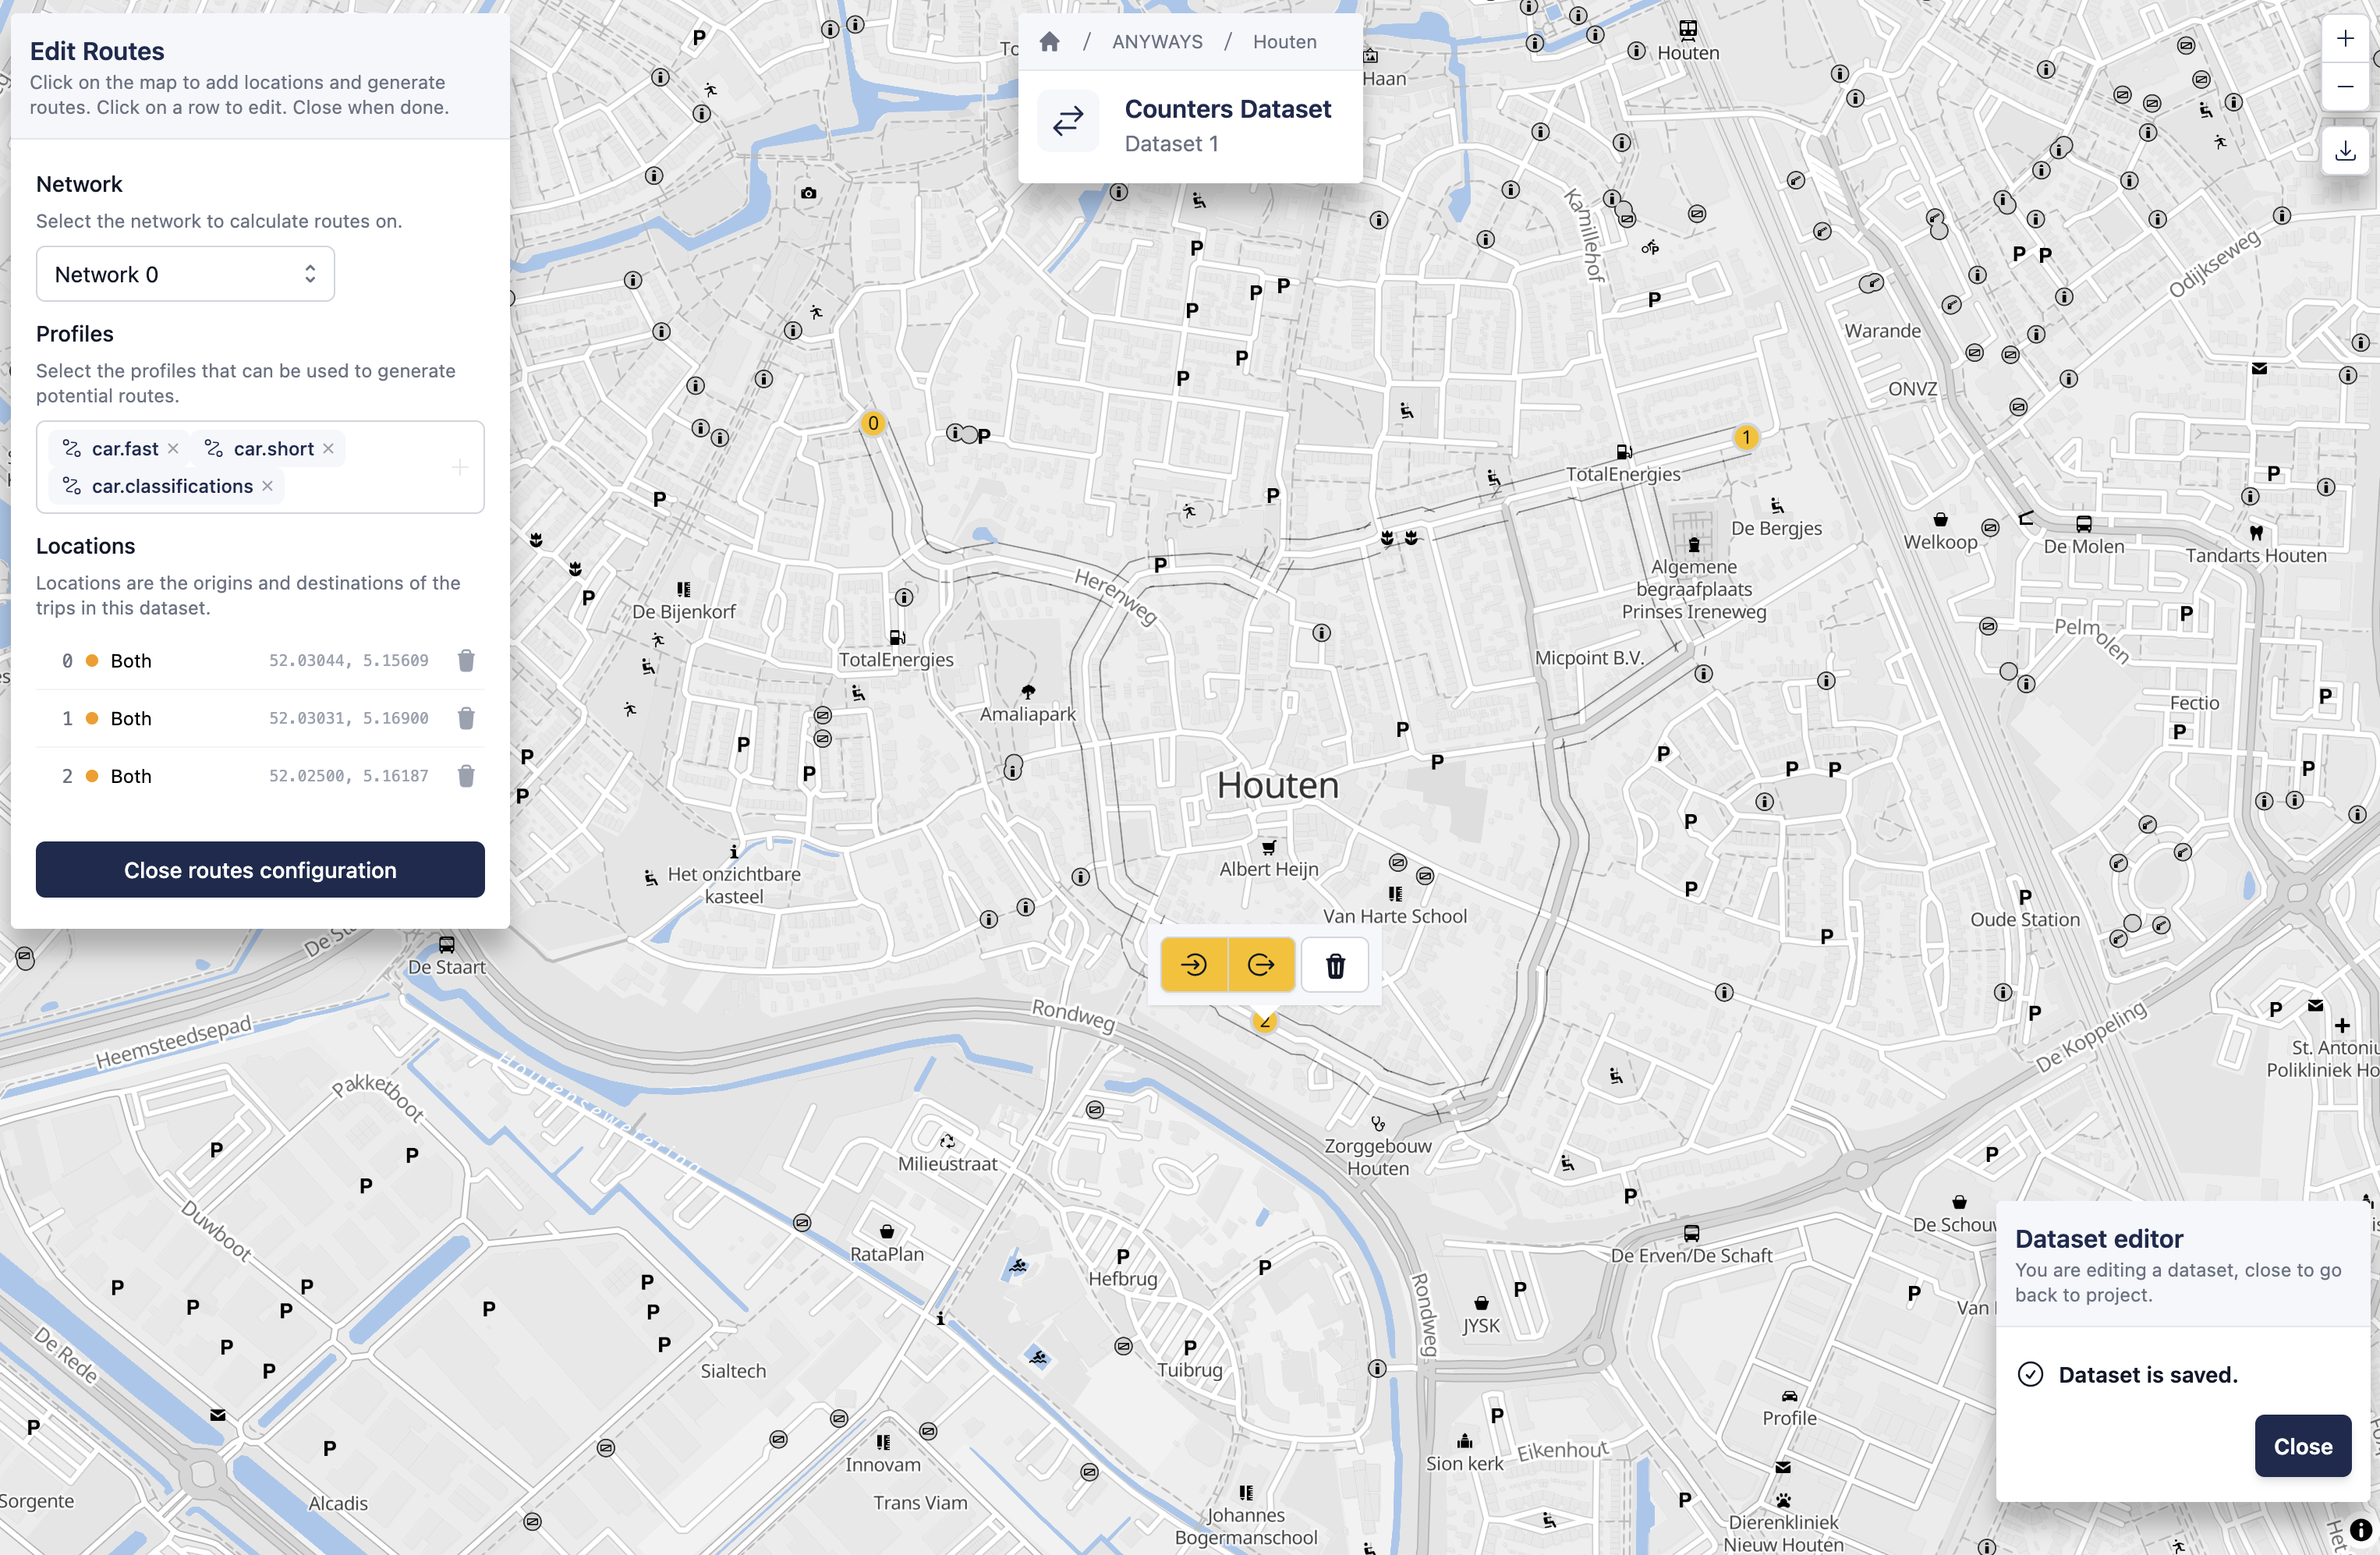
Click Configure routes to start. From there you can select profiles, choose a network, and add origin/destination locations on the map.
Configure profiles
Define the vehicle profiles that are used to estimate traffic demand. Profiles define the routing behaviour used to calculate the traffic matrix. Using multiple profiles results in more possible paths between origin and destination.
By default, the following car profiles are configured:
car.fast— fastest route
car.short— shortest route
car.classifications— route that follows the road hierarchy (prefers higher-classification roads)
You can add or remove profiles to control which vehicle behaviours are considered during the calculation. All available vehicle types can be used — including bicycle and pedestrian profiles — not just car.
Network selection
Below the profiles, you can select which network to use for calculating routes. Each network in your project represents a different version of the road network (e.g. before and after changes).
In most cases, you'll want to use Network 0 — the existing state of the road network. Traffic counts reflect real-world conditions, so the network used for the calculation should match the state of the roads when the counts were taken.
Add possible origin and destination locations
Define a set of locations that may act as origins, destinations, or both. These locations define the possible trips in the network.
Before adding locations, consider the following guidelines:
- Select key incoming and outgoing locations on the main roads around the study area
- Include locations that represent major access points to the area
- Optionally add a small number of relevant locations within the study area, they represent locations that produce or attract traffic.
The goal is to provide enough diversity of possible routes for the fitting process.
Initially, all possible trips between these locations have a traffic count of zero.
Click on the map to add a location. You can move or delete locations at any time.
Configure as origin, destination, or both
By default a location acts as both an origin and a destination. To change this:
- Click the location on the map, or select it from the list
- In the popup, toggle the origin and/or destination buttons
For example, on a dual carriageway you typically constrain a location to be just an origin or just a destination.
3. Counters
The second part of the workflow defines the traffic volumes using counters.
Click Configure counters to start. From there you can draw new counters on the map, or use existing counters when traffic count data is available for the area.
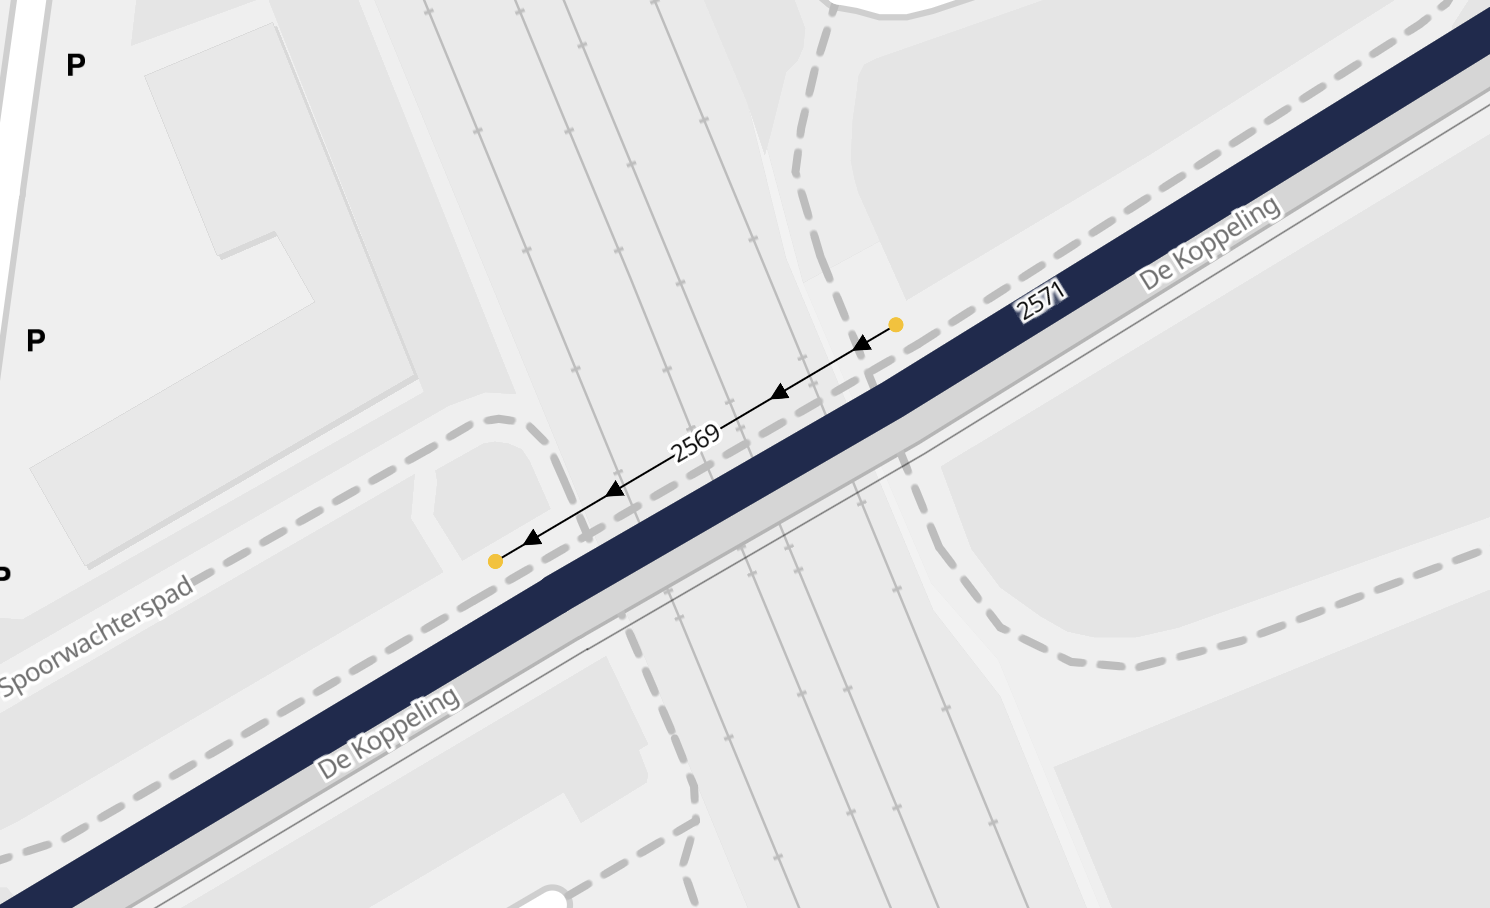
Draw a counter on a road segment
To add a counter on a road segment:
- Draw a short line next to the road where traffic was counted
- Draw the line in the direction of travel of the counted traffic
- Enter the counted number of vehicles in the popup that appears after drawing
Draw a counter at an intersection
To add a counter on an intersection:
- Draw the line of the counter from the incoming link to the outgoing one
- Enter the counted number of vehicles in the popup that appears after drawing
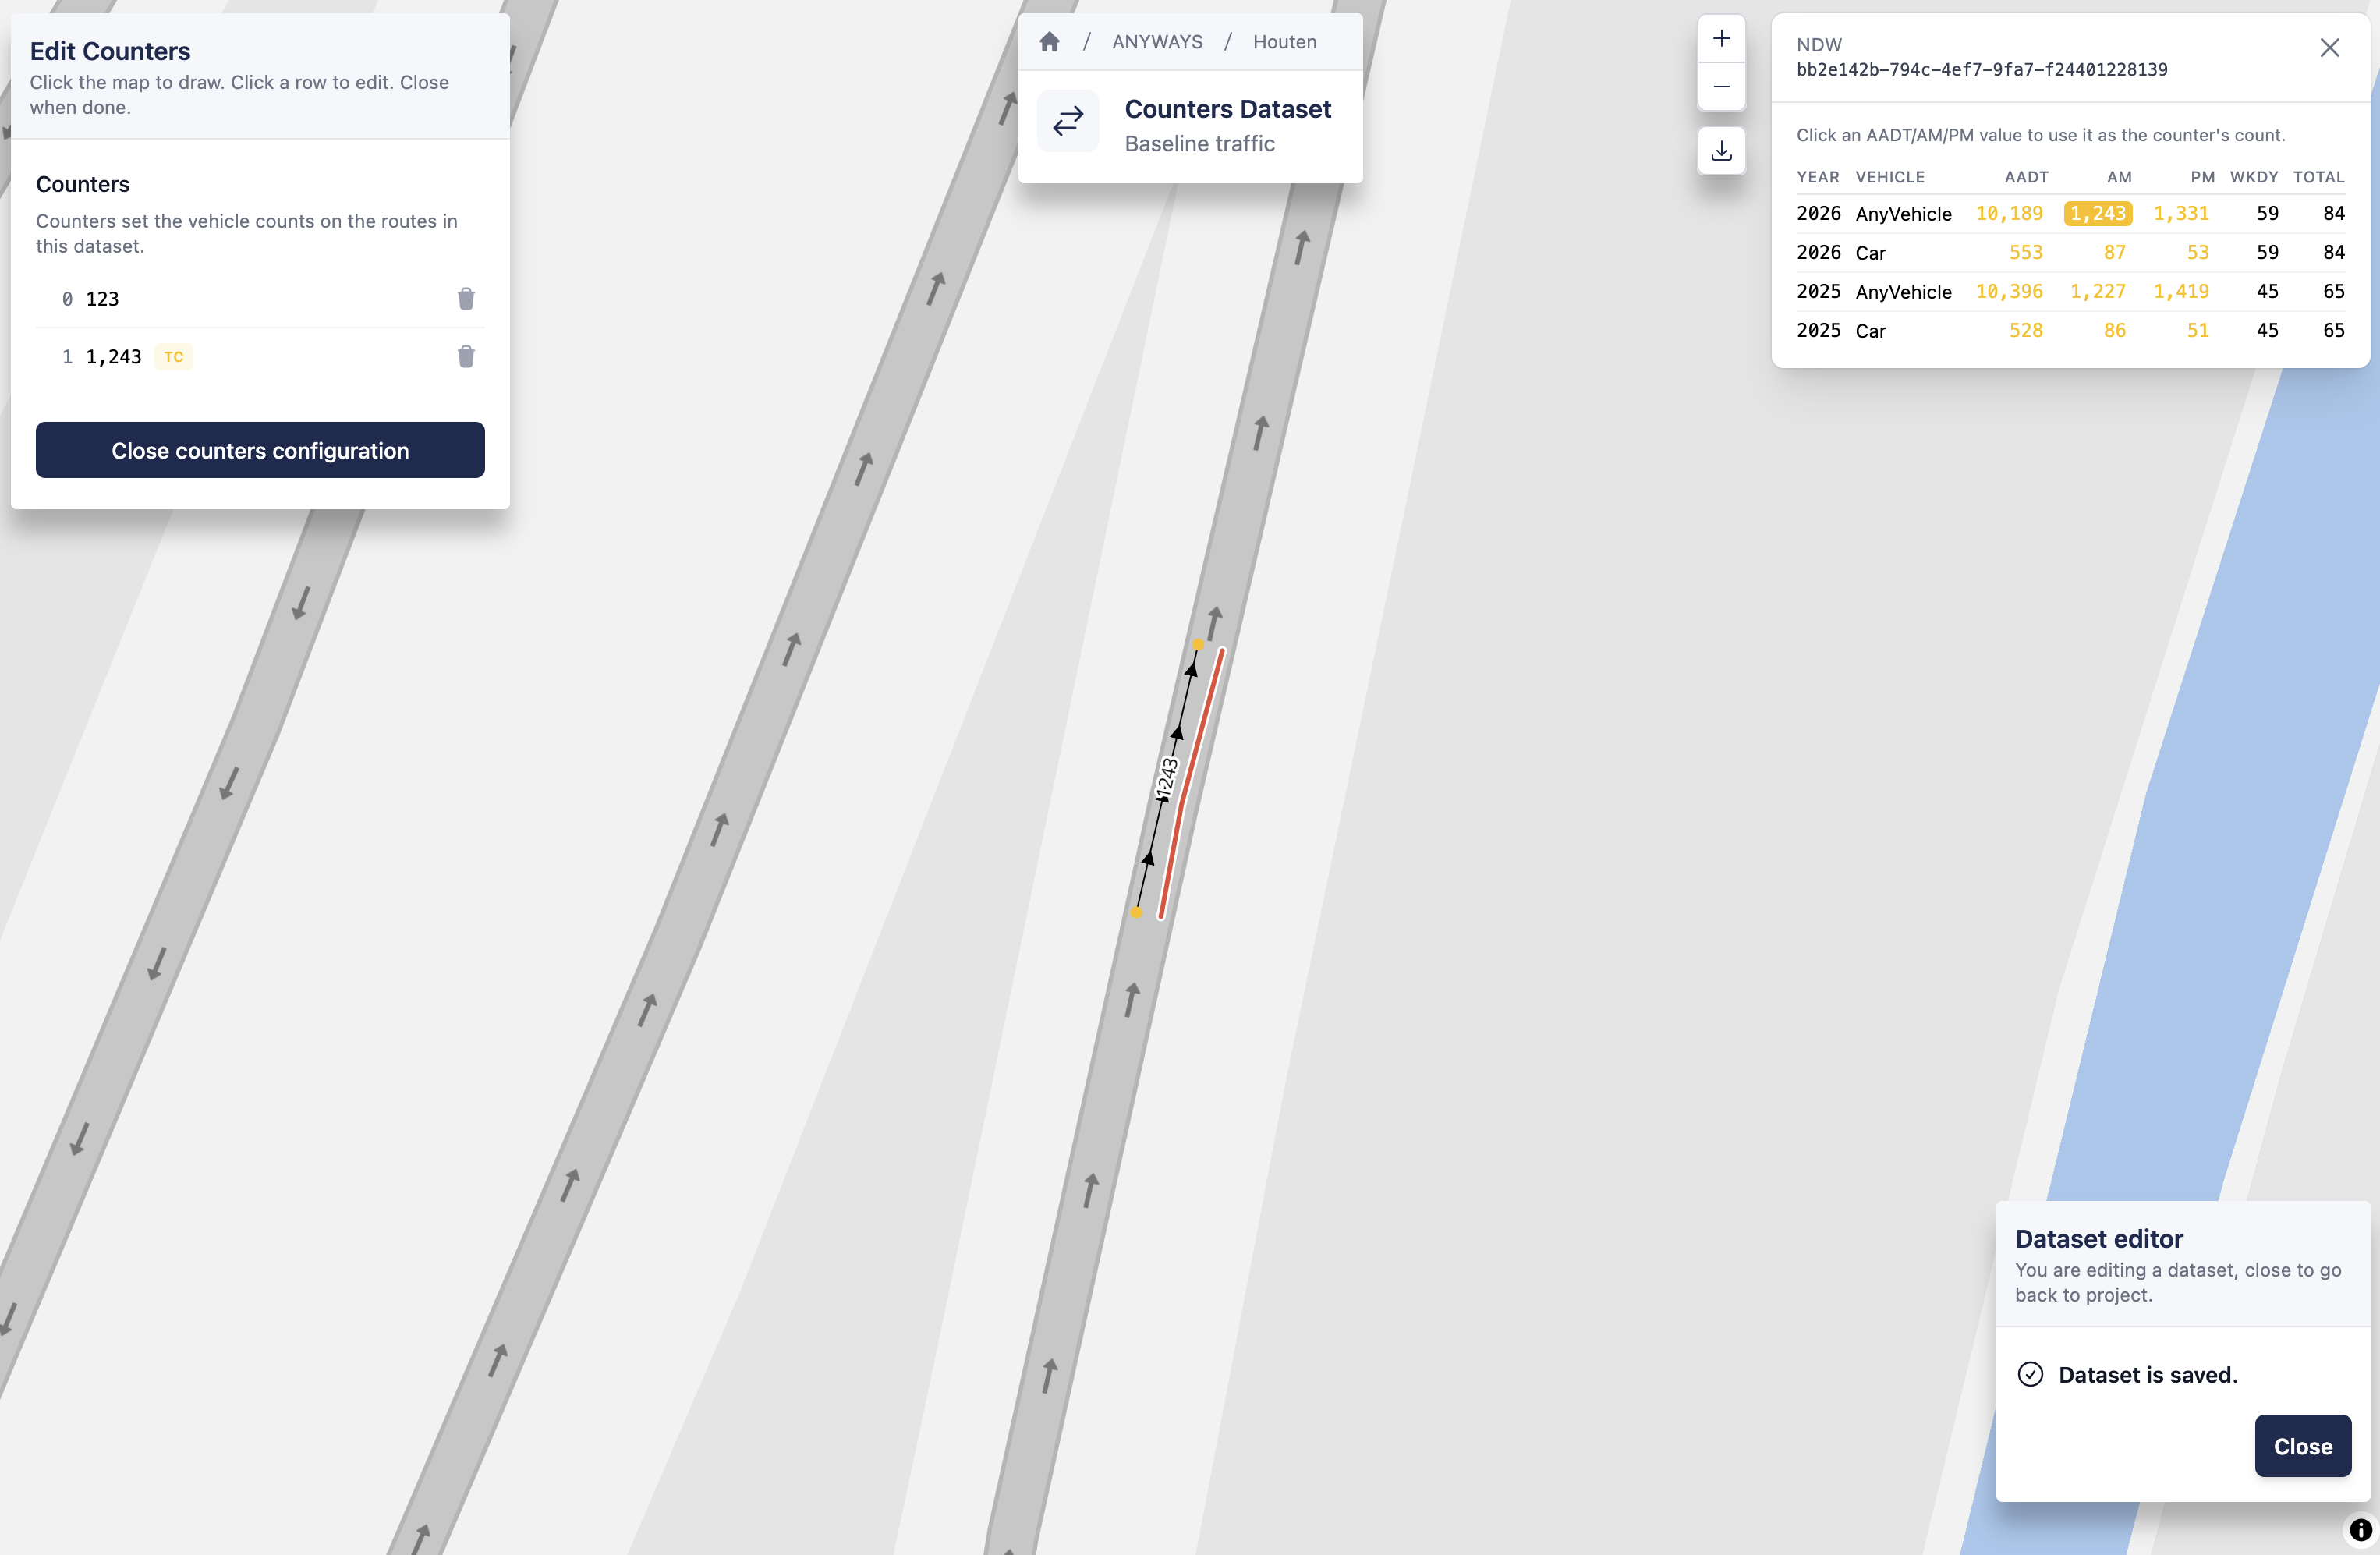
Use an existing counter from the map
When traffic count data is available for the area — for example, NDW in the Netherlands — existing counters appear on the map after you click Configure counters.
To use one:
- Click the existing counter on the map
- Select the value type you want: AADT (Annual Average Daily Traffic, a single average daily volume) or AM / PM (separate morning and evening rush-hour hourly volumes)
- The counter is created in your dataset with that value
Edit a counter
To edit a counter after it has been added, click it again on the map, or select it from the list.
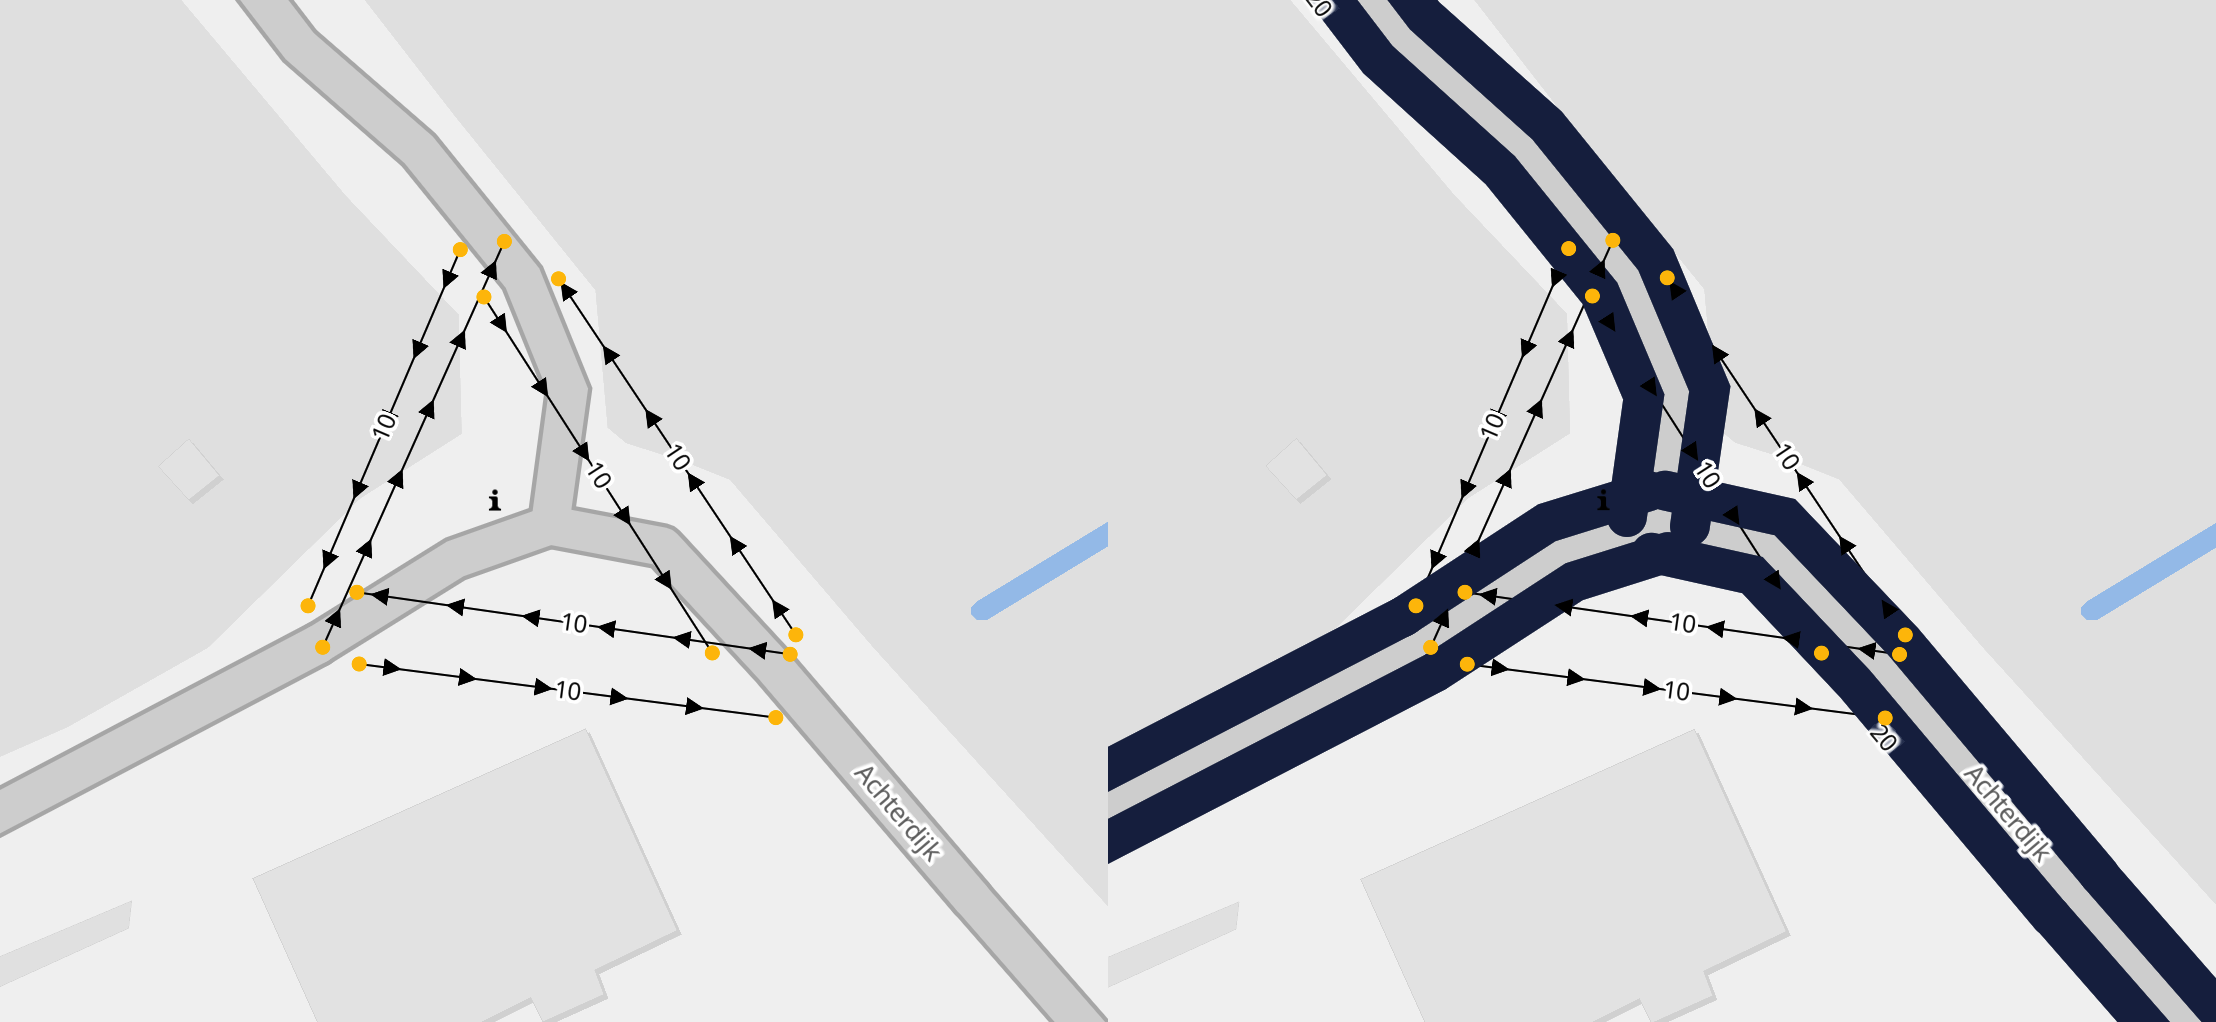
After adding traffic counters, the traffic volumes on all routes are updated to reflect the traffic counts as close as possible based on the available information. You can add as many counting points as you want, the algorithm will try to fit the OD matrix to represent the traffic counts.
4. Preview the fitted demand
Based on the defined origin–destination locations, traffic counters, and vehicle profiles the traffic demand gets estimated in a way that best matches the observed counts.
A preview of the resulting trips is calculated and shown on the map.
The dataset is ready and can be used in a scenario.
5. Return to project
✅ Once the calculation of demand is ready, that’s it! — you’ve simulated traffic using traffic counts.
You can close the dataset editor to return to the project.